Where Does Automated Customer Benchmarking Make Sense?

A customer benchmarking engine is an emerging technology which uses an artificial intelligence approach to automate the reasoning that underlies data-driven benchmarking. Its benefits are discussed here, there, and elsewhere. Briefly, it uncovers comparative insights on customers which empower customer-focused employees to be more proactive, or which are shown directly to those customers as a premium information service. The business benefits include churn reduction, market differentiation, extra revenue, and deeper customer relationships.

But, automated customer benchmarking doesn’t always make sense. So where does it? Here I’ll summarize the criteria that we’ve learned from clients, trials, conferences, discussions, and analysis.800px-Street_Sign_with_ideas

Data. A single organization collects data on its business-customers’ traits, behaviors, business outcomes, and feedback, e.g., via surveys. Lack of data on customer outcomes narrows the scope of the insights, which may still have internal value for account management. Also, the organization should not be contractually prohibited from performing comparative analysis across customers, appropriately anonymized if the resulting insights are to be shown to customers. Evidently, the data shouldn’t be wrong or mostly missing.

Motivation. The organization should be B2B because consumers (B2C) are generally less motivated to improve, because they are less driven by external stakeholders. The same lack of strong motivation may be found if the B2B organization serves very small businesses, which are less prone to carry out performance analysis: if they are tiny but making money, then life is good, and if they’re losing money, there are more-urgent issues to address. Think of your small neighborhood restaurant, for example.

Also, the business process that the organization supports with its services should not be seen as a utility, meaning that customers only care that the service be available when they need it, and little or nothing more. Think of an internet connectivity service, for example.

A strong positive indicator of motivation is when customers themselves ask the vendor organization how they’re doing compared to other customers, where they could improve, etc.

Comparability. In principle, benchmarking only makes sense if the benchmarked entities are comparable. It makes little sense to benchmark an elephant against an armchair and an airplane. Comparable doesn’t mean identical or even similar, just productively worthy of comparison. For example, a business consultancy that brings the smartest people in the world to fix whatever problem you have, whether it’s a leaky roof, runny nose, or buggy software, won’t have comparable customers. An HR SaaS company does have comparable customers, even if its customers range from the Fortune 500 to startups and in between, because HR has common elements across companies of any size or industry: employee motivation, compensation, tenure, promotion, recruiting, dismissal, etc. Comparability is a judgment call, but most B2B vendor organizations do have comparable customers, otherwise it would be hard for them to scale their business.

Scale. A customer benchmarking engine is a powerful tool that scales beautifully with the number of customers. But, just as a search engine is probably overkill if you only possess 50 documents, or a receptionist is overkill if you have 5 employees, benchmarking 50 customers likely isn’t worth the trouble, even though the engine will do its job. Given the tradeoffs, we believe that about 150 is the right minimum number of customers for automated benchmarking to make sense.

It’s worth citing some false disqualifiers which are wrongly believed to invalidate customer benchmarking, automated or not. (1) Customers need not be concentrated by industry or segment, much less be competitors, since one is benchmarking the customer’s business process that is supported by the vendor organization’s service, not benchmarking the customer’s overall market performance. (2) The data suitable for benchmarking is rarely scarce. For example, if a given metric (employee satisfaction, say) is potentially insightful, then so is the quarterly change in that metric, since it expresses a trend. Ditto for the change when compared to the same quarter last year. Thus, the insightful metrics are easily tripled, based on changes over time, as we’ve discussed elsewhere. (3) Data need not be perfect; it never is. And the end-result of imperfect data is not a plane crash, but a misleading insight, which tends to be caught and discarded before significant action is undertaken.

Now let’s summarize the four qualifiers data, motivation, comparability, and scale in a single brief sentence:  A customer benchmarking engine makes sense for B2B organizations that generate rich data on its 150+ non-tiny customers as a by-product of its non-utility-like, repeatable service.

Who are these organizations?  B2B SaaS (software as a service), Industrial Internet of Things, BPO (business process outsourcing), Managed Services Provider, and 3rd-Party Administrator, are generally good matches if they fit the other criteria.

Automation doesn’t always make business sense, especially when the enabling technology lies outside one’s own organization, which circumstance always involves a coordination cost. But automation scales well and can enable things or insights that don’t yet exist. Apart from the benefits discussed elsewhere, this article shares what we’ve learned about where the emerging technology of customer benchmarking engines makes sense.

Raul Valdes-Perez

Not Having Strategic Conversations with Customers? Here’s How to Fix That

I keep hearing that “our Customer Success Managers need to have more strategic conversations with our customers.” I’ve heard this in numerous discussions with many customer success executives over the last year. And more recently, I continued to hear the same thing while attending customer success conferences and meetups in San Francisco, Toronto, Denver and Pittsburgh. This is a big problem. If CSMs aren’t having strategic conversations with key customers, it will be very difficult to proactively move their accounts forward in any significant way. This keeps us all up at night.

I want to share a technique that customer success executives can use to help CSMs be equipped for strategic conversations with key accounts. For years, I worked with newer product managers to help them think more strategically. The technique I used was to ask three key questions that pushed them to seek the fundamental knowledge and insights they need for effective strategy discussions.  Below, I’ll share and unpack these questions that I’ve adapted for customer success managers.

Three questions CSMs need to answer to engage in strategic customer conversations

1.  Where is your customer going?

Strategy is what one intends to do to move from its current state to a desired future state.  Therefore, a CSM’s readiness for strategic conversations must begin with knowledge of a customer’s objectives and goals. If a CSM doesn’t know where a customer is going, how can they have any hope of engaging that customer strategically? When your CSMs knows this answer – down to the level of the organizational unit that purchased your solutions – they can add value in several ways: (a) focusing attention on actions that will have the most impact on a customer’s goals; (b) providing meaningful guidance to a customer; (c) evaluating a customer’s progress and (d) demonstrating the value they’ve realized.  When a customer is lacking effective goals, a CSM can help them. I discussed how a CSM can do this in a recent blog post.

2.  How will your customer get there?

I’d want the CSM to understand three items: (a) the primary approach a customer is taking to get to their desired future state; (b) the initiatives the customer will take to execute it and when; and (c) the role our solutions play in this. This knowledge of their customer’s strategy is important for several value-adding tasks including:

  • Identifying opportunities to add value with your other existing products, services and programs
  • Anticipating and prioritizing unmet customer needs
  • Aligning the roadmaps for products, services and programs with the needs of key accounts
  • Relating the actual use of your products, modules and features to the customer’s desired outcomes
  • Sharing best practices and lessons learned from other customers with similar strategies

3.  Where is your customer today?

The current state of the customer is often the focus of a CSM. But, for this question, I’d want to know if a CSM understands how a customer is doing versus their goals and versus benchmarks created from the results achieved by other similar customers. More specifically, do they know (a) Where is the customer doing well? (b) Where could they improve? (c) What has changed? (d) Where have we helped them effectively? (e) Where have we held them back? When a CSM has these comparative insights, they have the basis for adding value in several more ways including: prompting exploration of the reasons behind the results; sharing potential remedies known to work with other customers; and demonstrating the additional value a customer has realized with a solution.

Make the questions a regular activity

Strategic conversations with customers begin with understanding the strategic context of a customer. If your CSMs need to have more strategic customer conversations, try asking these questions on a regular basis in your internal customer review meetings. Because of your interest, your CSMs will put more emphasis on getting this information and understanding it. Plus, you’ll gain opportunities to coach and develop their strategic thinking skills.  Ultimately, when your customers and Customer Success Managers are talking strategically, customers will move closer to their goals and you’ll move closer to your goals.

Jim Berardone

Why San Mateo Daily Journal Really Doesn’t Like California’s Education Dashboards

In an editorial on March 22, the San Mateo Daily Journal called the new California School Dashboards “problematic”, “confusing”, and “useless”. It’s worth examining their perceptive reasoning, worthy of Silicon Valley, by reading the editorial, but the crux was this:

A dashboard in essence provides useful data, how fast you are going, what level your fuel is, if your engine is running hot, what your revolutions per minute are and if you need to check your engine. Based on your situation, one indicator may be more meaningful for you than others, but it is an apt description for a variety of indicators based on levels of data.

A car’s dashboard alerts to simple problems that call for immediate action:  slow down, get gas, or head to the mechanic. Dashboards were not designed to evaluate a driver’s or car’s ongoing performance, persuade that there’s a problem over a longer time scale, or motivate improvements, much less to compare performance to that of others. Making dashboards serve such goals leads to the editorial’s remark that “… how the information is presented is problematic and even the icons for performance levels are initially confusing.”

Overall, the editorial concludes that the California School dashboards don’t serve the goal of comparative evaluation, aka benchmarking:

The dashboard as it stands right now is fairly useless, and that could change once more information fills in. But the template also seems fairly poor as something parents may be able to use to see how their school is doing compared to other schools in the district or even other districts.

Except in narrow cases like a car running out of gas, we humans are best enlightened, persuaded, and motivated to act by language, which is why Daily Journals write editorials, and I write this post, rather than put up dashboards. Language deals quite well with quantitative information.

Raul Valdes-Perez


Customer Benchmarking Motivates Action

By Ed Powers, Principal Consultant at Service Excellence Partners, a Colorado consulting firm helping to improve customer loyalty and business performance at subscription-based technology companies.

Electric utility companies promoting power conservation programs discovered that simply informing consumers of their electricity usage relative to neighbors lowered overall consumption. This type of normative social comparison has produced the same effects in other domains. Why does this work? How can the idea be used in Customer Success?

Keeping up with the Joneses

Homeowners typically receive letters from the power company showing how many kilowatt hours they’ve used over the past month compared with other homes in the vicinity. In addition to bar charts, consumers see a “smiley face” if they’re doing well or a “frowny face” if they’re trailing the average. The mailers typically also include a list of recommendations for conserving energy.social norm
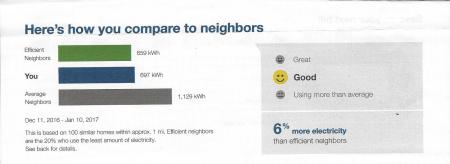
Surprisingly, this simple trick works. People change their behaviors when they see how they stack up against others. In multiple experiments run by the utility companies, providing benchmarks reduced overall power usage 2%.1 That may not sound like much, but across millions of homes the savings are substantial, helping power companies meet their government-mandated conservation goals. Similar outcomes from communicating descriptive norms have been shown in hospitality (reusing towels more often),2 voting (increasing turnout),3 and charitable giving (boosting the number of donors).4

What causes this behavior? Neuroscientist David Rock says subconscious social drivers are hardwired into our brains after eons of evolution.5 One primary driver is status, how we view ourselves in the “pecking order.” Social bearing means survival—whether it’s humans, birds, or wildebeest, members at the apex of the hierarchy are more likely to continue living and pass along genetic information. To aid our preservation, we reflexively perceive higher status as a reward and lower status as a threat. As a result, we savor outranking others and become anxious when we fall short.

Seeing rank expressed in numbers may increase the urgency to act. Neuroscientists have found that the brain uses the same circuitry to process number comparisons as it does to determine social status.6 The findings suggest we subconsciously use numbers to record social rank, and seeing status expressed numerically activates overlapping neural networks that may add fuel to our emotional response. Whenever emotions are strong, decisions and actions tend to follow.

Better business reviews

Many Customer Success Managers (CSMs) at Software-as-a-Service (SaaS) companies conduct Quarterly Business Reviews (QBRs) with senior executives at key accounts. Customers derive business value from deploying and using software, so a common objective is to ensure implementation milestones and adoption goals are met. Executive engagement and attendance at QBRs, however, is a chronic problem. Often CSMs do a poor job of describing how the software subscription impacts things like organizational productivity and decision making, but other times they simply fail to capture the attention of senior leaders.

Showing comparative data can help. Besides demonstrating progress vs. the customer’s goals, showing results relative to the customer’s own peer groups has greater impact. Executives are usually competitive people. When they see their organization is ahead of the pack, the fact suddenly becomes a talking point with their own bosses. When they see progress is behind the curve, they are more likely to push subordinates and make things happen. Sharing the tidbit garners increased attention and raises CSM status in the eyes of executives. “Information is power” is also true among top managers, and good intelligence is always appreciated.

The approach works at scale, too. Like the power company, automatically communicating descriptive social norms can move the needle in large populations of small customers. When SaaS companies show individual performance relative to benchmarks via tailored e-mails and in-product messages, they can influence behaviors in mass audiences without the need for personal contact. A simple change in how data are communicated can bump customer usage as well as CSM productivity.

New automation tools make the process much easier. OnlyBoth’s benchmarking engine uses artificial intelligence to automatically uncover readable, motivating, action-provoking insights and customer comparisons. CSMs can use this novel intelligence to nudge customers toward greater success during business reviews and for routine, personalized e-mail communications campaigns.

We’re naturally wired to compare ourselves with others. SaaS companies can easily capitalize on this basic human nature. And that would place them ahead of the pack.

References

1 Alcott, H. (2011). Social norms and energy conservation. Journal of Public Economics 95, pp. 1082-1095

2 Nolan, J., Schultz, W., Cialdini, R., Goldstein, N., Griskevicius, V. (2008). Normative influence is underdetected. Personality and Social Psychology Bulletin 34, pp. 913-923

3 Gerber, A. and Rogers, T. (2009). Descriptive social norms and motivation to vote: everybody’s voting and so should you. The Journal of Politics 71, January 2009, pp. 178-191

4 Frey, B., and Meier, S. (2004). Social comparisons and pro-social behavior: testing “conditional cooperation” in a field experiment. The American Economic Review, December 2004, pp. 1717-1722

5 Rock, D. (2008). SCARF: a brain-based model for collaborating with and influencing others. NeuroLeadership Journal

6 Chiaoa, J., Haradaa, T., Obyb, E., Lia, Z., Parrish, T. Bridge, D. (2008). Neural representations of social status hierarchy in human inferior parietal cortex. Frontiers in Neuroscience.


5 Tips to Help Customers with Goal-Setting in 2017

With the start of the New Year, the goals of customers are on my mind and the minds of many customer success managers. It’s no wonder. Goals help customers achieve success. They make it possible to align expectations. They focus efforts on what’s most important. Later, they will help to evaluate a customer’s progress and the value they’ve realized.

Across a customer base, I’ll usually see some customers with very strong, effective goals. They have clear goals for the outcomes they want to achieve, the milestones along the way and the near-term activities. Each of their goals are S.M.A.R.T.: specific, measurable, achievable, relevant and time-bound. They’re likely to be star performers.

At the same time, I’ll see other customers who have weak, ineffective goals. Amazingly, there are customers who don’t even have goals. These customers should be a red flag for customer success managers. Without effective goals, customers won’t be on top of the value they’re getting from your solutions, or the progress they’re making towards realizing value. Later, at a critical moment, they won’t be able to argue successfully for the continued purchase of your solutions. You’re likely to encounter a customer downsell or lose the customer.

The good news is this creates an opportunity for customer success managers to engage customers in setting more effective goals. While it can be challenging to get their engagement, there are various tactics that can be helpful.

Here are some tips that have helped me with goal-challenged customers:

1. Offer to give feedback.
Sometimes, a customer’s goals are unclear. For example, increase product sales and reduce lead generation expenses are too ambiguous to align expectations. When I recognize this, I’ll ask if they would like my perspectives and insights on their goals, based on my experience with other similar customers. I know the results others are getting and how they achieve them. I can tap into customer data to identify benchmarking metrics and benchmarks across similar customers, too. This knowledge gives me credibility and unique insights to share.

2. Ask insightful questions.
When a customer’s goals are too general and unclear, I try to move them from the abstract to the specific. I use a combination of questions (like those below) to help the customer think more critically about the outcomes they need to achieve. I want to help them frame their goals with business value in mind.

  • What are you trying to accomplish with our solution?
  • How do you see results changing with our solution?
  • How will you know you’re successful with our solution?
  • How does our solution help your business do what it does better?
  • How can our solution impact your company’s business goals and initiatives?

I want the customers to come away with goals that allow for effective expectation management, success planning and measurement of business value.

3. Confirm they have the right set of goals.
Some customers have goals that are incomplete. Often, I’ve found their goals are based on near-term actions to take such as “complete solution training for all sales development reps in Q1.” But, they’re missing goals for the business outcomes they need to achieve while using a solution. Other times, they have effective goals for these desired outcomes, but they’re missing goals for the actions to take to get there. I always look for goals for business outcomes, milestones along the way, and the near-term actions. If they’re missing any of these, or if they’re not connected, I know their path to value realization and success is at risk.

4. Let them know what’s realistic to achieve.
On occasion, customers will share their ’dream’ or ‘wish list.’ I appreciate their value for driving innovation and excellence, but unless goals are achievable, people will become disenchanted. Then, they lose the motivation to even set goals. This is where benchmarking with your own customer data can help. Share what’s best, worst and average for customers like them during the applicable stage of their journey with your business. Offer benchmarks relevant to their desired outcomes, as well as leading indicators which could be product adoption, product usage, key feature usage, program engagement and so on. I’ve found that helping customers develop realistic goals in this way strengthens relationships.

5. Tackle resistance to goal setting.
There’s always a cabal of customers that avoid setting goals. While many people credit their success to setting goals, there are others that don’t see the value or reason to do so. They’ll resist your efforts. Trying to engage these customers to discuss goals can feel like pouring gasoline on a fire. I remember a tech company CEO once told me “Jim, you’re not going to pin me down.” I knew then that neither he nor I would be successful. Several months later, the board replaced him.

I don’t back away from these resistors. I try to gain an understanding of their viewpoint by asking insightful ‘why’ questions. I hope to find common ground from where we can start and grow from there. In some cases, they believe they don’t have enough information to set a goal. You know what? Sometimes they’re right. Their business leaders haven’t set clear goals. Or, they bought the product without defining the desired business impact. When this is missing, I’ll try to persuade them to commit to a goal of gathering information that’s needed to set goals afterwards. Another tactic I’ve used is to encourage setting 1 or 2 ‘micro goals’ for a 3 to 6-month period. It can be easier for the customer to accept. It helps to build their skills and confidence which leads to success.

Wherever these customer conversations go, I emphasize what I’ve learned from experience: customers who set effective goals have more success than those that don’t.

Jim Berardone

7 Strategies to Benchmark SaaS Customers to Success

Customer benchmarking —  the practice of identifying where a customer can improve or is already doing well by comparing to other customers – helps Customer Success Managers to deliver unique value to their customers. The comparative insights from benchmarking motivate customers to make changes that produce better outcomes with their solutions. I’ve written more about this link in a recent post.

SaaS customer success leaders publicly encourage greater adoption of this practice. Peter Armaly, a customer success expert with Oracle Marketing Cloud, argued in his presentation at the 2016 Customer Success Summit that it should be a foundational activity of CSMs. In her featured post earlier this year, Kia Puhm, a customer experience consultant and a former executive with Adobe, Eloqua and Blueprint, advocated using customer benchmarking in every QBR, annual renewal discussion and proactive strategic meeting with customers. At the TSIA World conference in May, Rachel Barger presented how Lithium Technologies’ CSMs use their benchmarking program to make recommendations to customers.

I’ve found that SaaS vendors use seven distinct strategies to empower CSMs with customer benchmarking. The first two are longstanding strategies that rely on third-party data. The other five strategies leverage the data that is a byproduct of the vendor’s customer relationships and usage of their solutions. The last two of these five progressively use artificial intelligence to further automate the task.

Strategies Defined

Strategy 1: Customer Benchmarking using Industry Surveys

CSMs can leverage the benchmarking work of industry associations and research firms to help customers set performance targets, identify areas for improvement, and recommend best practices. These independent organizations sponsor benchmarking surveys that are completed by representatives of companies in the industry. The sponsor creates the survey, collects the data and does the analysis. The aggregated, anonymized findings are accessible in published documents or online tools for their members and customers.

With this strategy, the sponsor does all the work, but self-reported data can be unreliable and not specific to the SaaS vendor’s solutions or even customers.

Strategy 2: Customer Benchmarking using Best-Practices Studies

CSMs can help customers strive for superior outcomes by comparing their customer’s practices with the best practices. This approach studies a key business process of several companies that are perceived as the best in their industry and agree to participate. A third-party organization or the SaaS vendor sponsors an on-site study to collect mostly qualitative data on practices, key metrics and business context. The sponsor analyzes the data and reports what they’ve learned.

The sponsor does all the work for this strategy too, and superior practices can be found. But the SaaS vendor’s customers may see the practices of the best companies as unrealistic or irrelevant.

Strategy 3: Customer Benchmarking using Vendor Surveys

SaaS vendors can do their own benchmarking survey when their customer base is sufficiently large to obtain a representative sample. They analyze the aggregated data and share summary findings with their customers. A CSM collects data from an individual customer to compare how they’re doing versus the aggregated, anonymized results at a more granular level.

This strategy benefits from a survey that’s tailored to the vendor’s customer base, but it suffers from the same reliability drawbacks as Strategy 1.

Strategy 4: Customer Benchmarking using Data Scientists

When requested by CSMs, data scientists use their skills with statistics and modeling to mine the SaaS vendor’s data for deep, insightful correlations and comparisons. This is often a one-off solution, although procedures can be set up for recurring needs. The work involves advanced techniques such as regression analysis, stochastic frontier analysis and data envelope analysis using sophisticated software tools.

Data scientists may find unexpected insights by analyzing their own solutions and customer relationship data. The lack of scalability handicaps this strategy.

Strategy 5: Customer Benchmarking using Business Software Reports

By running reports on their aggregated customer data, CSMs can easily see how a specific customer compares with other customers on a given metric. A company’s adopted CRM, BI or CSM software platforms usually provide this capability. For example, customer success software platforms such as Amity and Gainsight generate a scorecard summary which lists the SaaS vendor’s customers and their performance on key metrics. A CSM sorts the list by a selected metric, calculates averages and filters the customers into a relevant group using various attributes.

CSMs can generate reports as needed with this strategy, but the reports contain data, not insights, and support only basic, manual analysis to find insights.

Strategy 6: Customer Benchmarking using your SaaS Product

SaaS vendors can enable their customers to benchmark themselves within their own software solution, which can be used by their CSMs, too. SAP, Apptio, ServiceNow, InsightSquared, Samanage, IQNavigator, ADP, Zendesk and other companies offer this capability. Using the vendor’s anonymized, aggregate customer data, a customer can compare itself against other customers of the same solution on various metrics, and CSMs can compare them also. SaaS companies develop basic benchmarking features in-house (such as scorecards, rankings, averages and several peer groups) or embed technology from specialized benchmarking software vendors like OnlyBoth that do this along with automated, in-depth analysis and narrative reporting.

Customers can get answers to some benchmarking questions on their own, but this strategy doesn’t make use of the internal vendor data that provides valuable benchmarking insights to CSMs but isn’t available for customer viewing.

Strategy 7: Customer Benchmarking using Specialized Benchmarking Software

With advanced automation available from several software firms, CSMs can get many more actionable and deep comparative insights for each customer quickly. Waypoint Group’s TopBox benchmarking module automatically analyzes for significant correlations between customer feedback responses and outcome metrics such as NPS and customer health for several customer peer groups. The Customer Benchmarking Engine available from OnlyBoth automates the data analysis, insight discovery, and narrative reporting by using artificial intelligence and the SaaS vendor’s data.

CSMs benefit from automated analysis which produces many more and deeper insights for each customer, overcoming the limitations of business software reports and data scientist scalability. The challenge is that CSMs are called on to make more judgments on which insights to use and share.

For a brief guide to the pros, cons and requirements of each strategy, see the paper “Pioneering SaaS Customer Success Leaders Seek New Customer Benchmarking Strategies to Deliver Value to Customers.”

Final thoughts

According to research by TSIA, CSMs at 25 percent of SaaS vendors are already using customer benchmarking. These pioneers have recognized the opportunity to enhance customer relationships and sustain their journey with the insights that only they can provide, because only they have the solution-specific data. With the data and strategies that are now accessible, more customer success organizations are poised to adopt this practice.

Jim Berardone

How is my county doing? Benchmarking 3,143 U.S. counties by jobs, income, crime, health, education, faith, rent, ethnicity, geography, population, and more.

How is your county doing, where could it do better, what’s been changing, and among similar counties, who does best?countiesOnlyBoth has launched a County Benchmarking Engine as its newest showcase application and public service, leveraging the availability of federal as well as private-sector data on all 3,143 U.S. counties. We collected data on 104 county attributes by these topics:

Here’s an example of an “Only, both”-style insight about Bronx County in New York City:

Only Bronx County in NY has both as high a median rent for a 3-bedroom unit ($2,293) and as low a median household income ($33,687).

The flip side, for a 1-bedroom apartment this time, is seen in Audubon County, Iowa (population 5,773)  about 1,200 miles away:

Only Audubon County in IA has both as high a per-capita income ($30,714) and as low a median rent for a 1-bedroom unit ($474.00).

Notably, San Francisco County in CA is among the top-15 nationwide in all these 9 categories, in order of their appearance:

  1. 3rd-highest Asian population (33.0%)
  2. 10th-least male obesity (14.8%)
  3. 10th-most residents employed in services (71.8%)
  4. 8th-highest foreign-born population (35.5%)
  5. 11th-highest per-capita income ($49,986)
  6. 11th-least obesity (15.5%)
  7. 10th-biggest advantage, relative to its home state, in per-capita income (+67.1%)
  8. 12th-least female obesity (16.1%)
  9. 13th-least owner-occupied housing (36.6%)

but residents pay for it with the highest median rents in the whole country, for a 0-bedroom (studio/efficiency) unit ($2,072), a 1-bedroom unit ($2,610), and a 3-bedroom unit ($4,250).

Re-visiting New York city, let’s consider this time New York County (i.e., Manhattan). It’s doing well on many dimensions, although unsurprisingly its rents are high. But there’s a residual problem:

Of the 103 counties that have at least $75,459 in median household income, only New York County in NY has decades-long substantial child poverty.

Let’s close out on a high note. Many of the data attributes involve changes over time, so the engine benchmarks not only on characteristics during a single time period, but on changes or trends from one period to a next. Elsewhere we’ve called that space-time benchmarking. Here’s a good outcome on the populous Fairfax county in Virginia, adjacent to Washington DC:

Fairfax County in VA is one of only 3 counties that improved or maxed out on all the obesity and diabetes change metrics (there are 4 of these, and each county needs at least 3 with actual values to qualify).

Fairfax County in VA improved or maxed out on these:

change over 4 years in the prevalence of female obesity = -2.2% (from 22.5% to 20.3%)

change over 4 years in the prevalence of male obesity = -0.5% (from 20.4% to 19.9%)

change over 4 years in the prevalence of obesity = -1.4% (from 21.5% to 20.1%)

change over 9 years in the prevalence of diabetes = -0.4% (from 6.6% to 6.2%)

As we’ve seen, it’s now possible, after a few days of software configuration, to create significant economic or social value by generating numerous performance insights on thousands of benchmarked entities, and later update these insights by figuratively pushing a button to update the insights with updated data.

Try the County Benchmarking Engine yourself at county.onlyboth.com.

Raul Valdes-Perez

Why Your Customer Success Managers Need Comparative Insights for Each Customer

“If you’re not getting better, you’re getting worse.”

What do executives mean when they use this phrase? They know that if their company stays as they are, eventually they’d get worse compared to their competitors.  Their competitors’ success forces them into changing how they perform, and vice versa. Hence, their company has to keep getting better, even if it isn’t sick.

Take a look at Salesforce.com in 2004. They had 20,000 customers of their cloud-based CRM software, up from about 6,000 a few years earlier. They were rapidly on their way to reaching unicorn status of a $1B market cap. But they were losing 8% of their subscribers each month. Yikes! That’s a big problem when a recurring revenue business depends on growing revenue from its customer base. Salesforce responded by changing from
reactively to proactively managing its existing customer relationships. They eventually succeeded in reducing customer churn to 1% per month and the loss of customers to their competitors. Their competitors had to follow suit to keep up. Now, proactive customer success management is one of the hottest movements in business today.

What does this mean for your Customer Success?
All of your customers need to keep improving, too, or they’ll fall behind. And your customers know this. Consequently, they need to know how they’re doing and where they can improve versus others like them. These comparative insights motivate improvement actions inside their companies, which leads to achieving their desired business outcomes — including staying competitive.

If your company offers cloud-based, recurring revenue solutions such as a SaaS subscription, then you have data that’s a byproduct of your customer relationships and their usage of your solutions. As your customers are buying the same solutions for similar business reasons, this data contains a rich source of comparative insights for each customer – insights they can’t get anywhere else.

Your customers can use these unique insights to improve. That’s important to you, too. If they’re not improving, then their outcomes, health and loyalty won’t improve, and you won’t achieve the retention and upselling rates that your company needs to grow.

Comparative insights help Customer Success Managers do their job better.
Today, your CSMs likely use customer data to gain a full picture of an account and to evaluate a customer’s likelihood for renewing, buying more or advocating your solution. This customer insight serves your company well, whereas comparative insights serve your customers well. With unique comparative insights, CSMs can deliver more value to each customer in each interaction. They’ll get a better response to their proactive outreaches, have more strategic conversations with key stakeholders during quarterly business reviews and, most importantly, provoke customer actions to improve their behaviors with your solutions.

Generating comparative insights
The process of identifying areas where one can improve by comparing to others is called benchmarking. With your own data, your CSMs can use benchmarking, too. You can create scorecards with a spreadsheet or CSM software product to rank customers and do simple performance comparisons on individual metrics. If you have relevant benchmarks or targets, CSMs can draw additional insights. But the really noteworthy, action-provoking insights are much harder to find. You’ll need data analysts or data scientists who can perform deep, comparative analysis involving complex correlations, comparisons and clustering across multiple dimensions. Unfortunately, they’re in short supply and CSMs have to wait in line to get what they need.

As a result, CSMs settle for rankings and benchmarks without the deeper analysis, which has limited value. It’s like they have Consumer Reports’ published rankings and performance ratings of cars but without the written analysis for each.

An easy, scalable way to get comparative insights
I’m quite excited that, just last week, my company OnlyBoth announced a new customer analytics solution that can help CSMs take full advantage of the unique insights that exist in their company’s data. OnlyBoth’s Customer Benchmarking Engine uses artificial intelligence to completely automate the searching, analysis and reporting of comparative insights in data. CSMs can simply enter a customer name and get numerous comparative insights in seconds. The software performs a massive, sophisticated data analysis that would take many data scientists many months to do.

Here’s an example of a deep, comparative insight the engine found in the data we gave it. This insight is written up by the software using its natural language generation technology.

insight-example-1

Rhynyx is amongst a group of 55 customers who are using a vendor’s HR software suite more actively than their other customers. However, Rhynyx is not keeping pace with their use of the recruiting module, a core sticky function of the vendor’s HR suite. A CSM can use this insight to proactively engage Rhynyx to examine the root causes and take action so they can achieve similar outcomes to those 55 peer customers.

You can see more examples and learn about our software here.

As someone who sits at the intersection of customer success leadership and benchmarking innovation, I hope to share more about this important but under-discussed topic in future posts. If you have experiences and lessons learned with using benchmarking and comparative insights for Customer Success, I’d love to hear from you.

Jim Berardone

Benchmarking the Tax Systems of 195 Countries

Taxation at the national level is controversial. Economists gather data and form opinions, and so do politicians. Factual, comparative insights on worldwide tax systems are needed. So we applied an automated Benchmarking Engine (taxes.onlyboth.com) to tax data on 195 countries, uncovering 7,617 insights or about 39 insights each, in perfect English, all automated.

paying taxes

Paying the Tax (Collector), by Pieter Brueghel the Younger

The U.S. Agency for International Development publishes a fascinating Collecting Taxes Database on the tax systems of the world’s countries.  The database expresses 33 attributes relating to various metrics and traits, relating to tax rates, efficiency in collecting the revenue that the rates target, diversity in sources of tax revenue (VAT, personal income, corporate, etc.), tax administration, and so on.

We downloaded the latest available version (2012-2013) as well as an earlier 2009-2010 version, in order also to express changes over a three-year interval and enable benchmarking on trends.

The U.S. corporate-tax system is controversial because of its very high rate.  Does the engine find any noteworthy insights relating to corporate taxation?  Indeed it does, which we’ll quote at length:

USA has the lowest corporate income tax productivity (0.07) of the 32 nations with at least 9.3% personal income tax collection as a percentage of GDP (USA is at 11.8%). That 0.07 compares to an average of 0.24 and standard deviation of 0.24 across the 32 nations.

Reaching the average of 0.24 would imply a total increase of 5.9% (absolute) in corporate income tax collection as a percentage of GDP.

USA has these standings among those 32 nations:
corporate income tax collection as a percentage of GDP = 2.6% (8th-least)
corporate income tax rate = 35.0% (most overall)

trailed France (0.08), Malawi (0.08), Austria (0.09), and Belgium (0.09), and others, ending with Algeria (0.86).

1 out of the other 31 nations was ruled out due to missing, unknown, or not-applicable values for corporate income tax productivity, i.e., Angola.

Let’s interpret this. First, it says that the U.S. has the highest corporate income tax (35%) in the world. However, this high rate leads to a low revenue outcome, as indicated by the low 0.07 productivity score.  The Collecting Taxes Database calculates this corporate-income-tax productivity by “dividing the ratio of total corporate income tax revenues to GDP by the general corporate income tax rate.”

Not only is productivity low, but it’s the lowest of the 32 nations that collect a significant share (at least 9.3%) of personal income in relation to GDP (gross domestic product). It’s lower than France, Malawi, and others.  Here’s a plot:

U.S. corporate income tax productivity
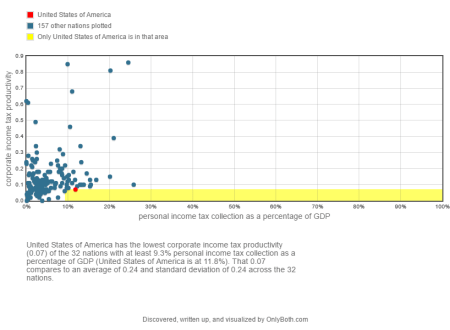
A separate insight reveals that the U.S. has the lowest corporate-income-tax productivity of the 17 nations with an agriculture sector as a percentage of GDP of at most 1.6% (the U.S. is at 1.2%).

Now let’s click on What’s best in class? to see what the U.S. could aspire to, as shown by nations that are similar, i.e., whose overall values in the database are most similar to the U.S.  It turns out that Hong Kong and South Korea do best among the 20 countries most like the U.S.

Hong Kong has the highest corporate income tax productivity (0.32) among the 20 nations most similar to USA (with 0.07) that likewise have a high-income economy.

Next with 0.18 is South Korea.

USA is 35th best among the 40 nations with applicable values and that have a high-income economy, which range from a worst of 0.02 (Bahrain) to a best of 0.99 (Qatar), with an average of 0.20 and standard deviation of 0.21.

Among all 164 nations with applicable values, the overall average is 0.15 and standard deviation is 0.16. Best is Qatar, with 0.99.

As is typical of a benchmarking engine, we can leave it to human experts – economists and political leaders in this case – to figure out whether the U.S. has a tax problem, what’s causing it, what are possible solutions, and which solution is best.  Our aim has been to provide this Taxes Benchmarking Engine as a public service and as a showcase of what automated benchmarking can do, as was done earlier for college financials, hospitals, and nursing homes.

Benchmarking need not be taxing. Simply enter any country at taxes.onlyboth.com and see how it’s doing, where it could improve, what’s trending, and what’s best in class.

Raul Valdes-Perez


Benchmarking 15,665 Nursing Homes

Today OnlyBoth launches as a public service what is likely the largest benchmarking analysis ever conducted, as measured in terms of readable language output.

The U.S. has about 1.4 million residents of nursing homes and 15,665 Medicare or Medicaid certified nursing homes. The federal government, through its regulatory powers and reimbursement function, collects performance data on all of these nursing homes, which cry out for comparison in order to understand how each is doing and where each falls short, compared to all peers or their subsets, without bias.

CambridgeMA_Cambridge_Home_for_the_Aged_and_Infirm (1)

We downloaded data from the federal Nursing Home Compare website and spent a couple of days consolidating the information and configuring our Benchmarking Engine, then pushed a button (figuratively!) and waited just a day and a half. The output consists of 642,192 insights, totaling more than two Encyclopaedia Britannicas in terms of English words contained in grammatical, to-the-point sentences and paragraphs. Enter a nursing home and browse the insights at http://nursing.onlyboth.com.

What did the benchmarking engine find?  At one extreme, the engine found the most things to say about Signature Healthcare at Saint Francis in Memphis, TN although most of these were not complimentary. There is clearly room for improvement there.

We often say that a massive analysis, as only an automated benchmarking engine can do, can find specific areas where even the best can improve. We discussed such a case – Stanford University Hospital – while launching our earlier hospitals benchmarking engine.

Let’s revisit sunny California. The US News & World Report lists Edgemoor Hospital in Santee, CA as the top nursing home in California, due to its top five-star rating in all the major categories. Could even Edgemoor improve? The engine reveals several areas for improvement, this one for example:

Edgemoor Hospital in Santee, CA has the most facility-reported incidents (9) of all the 200 nursing homes that have the top rating in each of overall, health inspection, quality measures, staffing, and registered-nurse staffing (5 total). Those 9 represent 18.8% of the total across the 200 nursing homes, whose average is 0.2.

Now let’s consider Bridgepoint Sub-Acute and Rehab Capitol Hill in Washington, DC which is the nursing home nearest Capitol Hill, where Congress meets. This facility does especially well in bladder and bowel control among low-risk, long-stay residents, as compared to other for-profit facilities that locate within a hospital. The engine found six specific areas for keen improvement, the first of which is this:

Bridgepoint Sub-Acute and Rehab Capitol Hill in Washington, DC has the 3rd-most high-risk long-stay residents with pressure ulcers (24.8%) among the 1,982 Mid-Atlantic nursing homes. That 24.8% compares to an average of 6.4% across the 1,982 nursing homes.

Another noteworthy insight it that the facility has “the most severe deficiencies on the health survey (5) of the 718 nursing homes that have the top rating in each of quality measures, staffing, and registered-nurse staffing.

This application is launched as a public service as well as a technology showcase, benchmarking well over triple the number of entities that were benchmarked in our previous largest application, to 4,803 hospitals. The relevance to business is this:  the advent of cloud services, internet of things, and other means for collecting customer performance data will enable the automated benchmarking of business processes, generating tremendous economic value by benchmarking 10,000 entities with the same amount of work as benchmarking 10 entities.

Our goal is universal betterment by providing persuasive, motivating insights that pinpoint what is going well and where improvement is sorely needed and is achievable. Benchmarking Engines will do for business benchmarking what Search Engines did for information seeking, assigning to computers what they do better – massive comparisons – and to people what they do better – evaluating and following up, as appropriate – on benchmarking insights.

Raul Valdes-Perez