Taxation at the national level is controversial. Economists gather data and form opinions, and so do politicians. Factual, comparative insights on worldwide tax systems are needed. So we applied an automated Benchmarking Engine (taxes.onlyboth.com) to tax data on 195 countries, uncovering 7,617 insights or about 39 insights each, in perfect English, all automated.

Paying the Tax (Collector), by Pieter Brueghel the Younger
The U.S. Agency for International Development publishes a fascinating Collecting Taxes Database on the tax systems of the world’s countries. The database expresses 33 attributes relating to various metrics and traits, relating to tax rates, efficiency in collecting the revenue that the rates target, diversity in sources of tax revenue (VAT, personal income, corporate, etc.), tax administration, and so on.
We downloaded the latest available version (2012-2013) as well as an earlier 2009-2010 version, in order also to express changes over a three-year interval and enable benchmarking on trends.
The U.S. corporate-tax system is controversial because of its very high rate. Does the engine find any noteworthy insights relating to corporate taxation? Indeed it does, which we’ll quote at length:
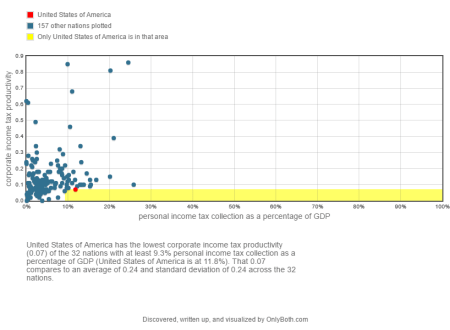
USA has the lowest corporate income tax productivity (0.07) of the 32 nations with at least 9.3% personal income tax collection as a percentage of GDP (USA is at 11.8%). That 0.07 compares to an average of 0.24 and standard deviation of 0.24 across the 32 nations.
Reaching the average of 0.24 would imply a total increase of 5.9% (absolute) in corporate income tax collection as a percentage of GDP.
USA has these standings among those 32 nations:
corporate income tax collection as a percentage of GDP = 2.6% (8th-least)
corporate income tax rate = 35.0% (most overall)trailed France (0.08), Malawi (0.08), Austria (0.09), and Belgium (0.09), and others, ending with Algeria (0.86).
1 out of the other 31 nations was ruled out due to missing, unknown, or not-applicable values for corporate income tax productivity, i.e., Angola.
Let’s interpret this. First, it says that the U.S. has the highest corporate income tax (35%) in the world. However, this high rate leads to a low revenue outcome, as indicated by the low 0.07 productivity score. The Collecting Taxes Database calculates this corporate-income-tax productivity by “dividing the ratio of total corporate income tax revenues to GDP by the general corporate income tax rate.”
Not only is productivity low, but it’s the lowest of the 32 nations that collect a significant share (at least 9.3%) of personal income in relation to GDP (gross domestic product). It’s lower than France, Malawi, and others. Here’s a plot:
 A separate insight reveals that the U.S. has the lowest corporate-income-tax productivity of the 17 nations with an agriculture sector as a percentage of GDP of at most 1.6% (the U.S. is at 1.2%).
Now let’s click on What’s best in class? to see what the U.S. could aspire to, as shown by nations that are similar, i.e., whose overall values in the database are most similar to the U.S. It turns out that Hong Kong and South Korea do best among the 20 countries most like the U.S.
Hong Kong has the highest corporate income tax productivity (0.32) among the 20 nations most similar to USA (with 0.07) that likewise have a high-income economy.
Next with 0.18 is South Korea.
USA is 35th best among the 40 nations with applicable values and that have a high-income economy, which range from a worst of 0.02 (Bahrain) to a best of 0.99 (Qatar), with an average of 0.20 and standard deviation of 0.21.
Among all 164 nations with applicable values, the overall average is 0.15 and standard deviation is 0.16. Best is Qatar, with 0.99.
As is typical of a benchmarking engine, we can leave it to human experts – economists and political leaders in this case – to figure out whether the U.S. has a tax problem, what’s causing it, what are possible solutions, and which solution is best. Our aim has been to provide this Taxes Benchmarking Engine as a public service and as a showcase of what automated benchmarking can do, as was done earlier for college financials, hospitals, and nursing homes.
Benchmarking need not be taxing. Simply enter any country at taxes.onlyboth.com and see how it’s doing, where it could improve, what’s trending, and what’s best in class.
Raul Valdes-Perez
