Comparing yourself to peers – also known as benchmarking – lets you understand how you’re doing, identify performance gaps and opportunities to improve, and highlight peer achievements that you could emulate, or your own achievements to be celebrated. As long as data is available, peer comparison can potentially accomplish all of these. The opportunities for peer comparison are greatly increasing due to cloud and other services that generate data as a by-product of serving customers.

The problem is that peer comparison as generally practiced suffers from Tunnel Vision and so misses a lot, to everyone’s detriment. To understand why, let’s first consider an analogy to search engines.
An information seeker, before there were search engines, might have gone to consult a librarian on, say, computers and heard “That’s technology, so look in the Technology books section, over in the back, by the right.” But there’s plenty of material on computers that’s catalogued elsewhere, e.g., automation’s impact on employment and job training, the philosophical question of whether computers in principle could do everything that people do, cognitive modeling of human reasoning using computers, computer history, and so on. The point is that looking only in the Technology section is an example of Tunnel Vision, or maybe bookshelf vision. Search engines changed that.
So where’s the Tunnel Vision in peer comparisons? It’s almost universal practice that the benchmarker chooses one or two organizational goals, then picks a few key metrics (key performance indicators) relevant to those goals, and finally selects several peer groups from a limited set. The outputs are then the mean, median, distribution, or high-percentile values for those peer groups on those metrics. The conclusion is that the organization may or may not have a problem, which may or may not be addressable. The flaw in all this is that organizations have many goals and subgoals, and many metrics that could reveal performance gaps, especially if a very large set of peer groups could also be explored. But our human inability to explore many paths in parallel imposes this Tunnel Vision, for the same reason that pre-search-engines information seekers went looking in one or two sections of the library.
As an example of peer-group selection, suppose you wanted to compare the U.S. against other nations. What would be the right peer group? Here are some that make sense: democracies; the Anglosphere; constitutional republics; large countries; developed countries; OECD or NATO members; the western hemisphere; non-tropical countries; largely monolingual countries; business-friendly economies; and even baseball-playing nations. Moreover, peer groups could be formed dynamically, e.g., countries at least as big as the U.S. in population or territory. And what would be the right metrics? The mind boggles at the number of interesting possibilities, all of which may have available data. As already pointed out, standard practice is to first specify an overarching goal, which then drives the choice of metrics and peer group. (Some web examples of standard benchmarking outputs are here, there, and elsewhere.) But what if the goal is to understand broadly how you’re doing and where you could improve? Tunnel Vision is caused by over-specific goals, limited metrics, and biased peer groups, all part of standard benchmarking practice which is made obsolete in the face of exploring all interesting metrics and potential peer groups that could lead to operational improvements.
Let’s run some numbers to show the scope of Tunnel Vision. Suppose there are 10 attributes with yes/no values and another 10 attributes that can take on any of five different values, plus one attribute that can take on 50 values, e.g., a U.S. state. There are theoretically 210 x 510 x 50 = 500 billion peer groups. Even if we include only peer groups whose attribute values match those of the specific individual to be benchmarked, the number would be 221 = 2.1 million peer groups.
Let’s move from the abstract to the concrete. Here are two (accurate) peer comparisons that are arguably insightful:
1. St Anthony Community Hospital in Warwick, NY has the lowest average time patients spent in the emergency department before they were seen by a healthcare professional of all the church-owned hospitals in the mid-Atlantic.
2. Macalester College in Saint Paul, MN has the highest total student-service expenses of any big-city private college that doesn’t offer graduate degrees.
Note the peer groups: (1) church-owned; mid-Atlantic; and (2) big-city; private; doesn’t offer graduate degrees. Now consider an imaginary peer comparison that uses four attributes to form a noteworthy peer group:
3. Cumulus Inc. is the most profitable of all the B2B, cloud-based, venture-backed companies that have at least 200 customers.
We see that considering more peer groups leads to uncovering more valuable benchmarking insights. Since the number of possible peer groups is vast, and benchmarking has seen little automation, this means that Tunnel Vision is necessarily widespread.
But the Tunnel Vision gets much worse! Peer groups can be formed, not just by picking non-numeric (aka symbolic) attributes, but also by dynamically determining numeric thresholds. Here’s a revealing (and true) insight that contains a dynamically-formed peer group:
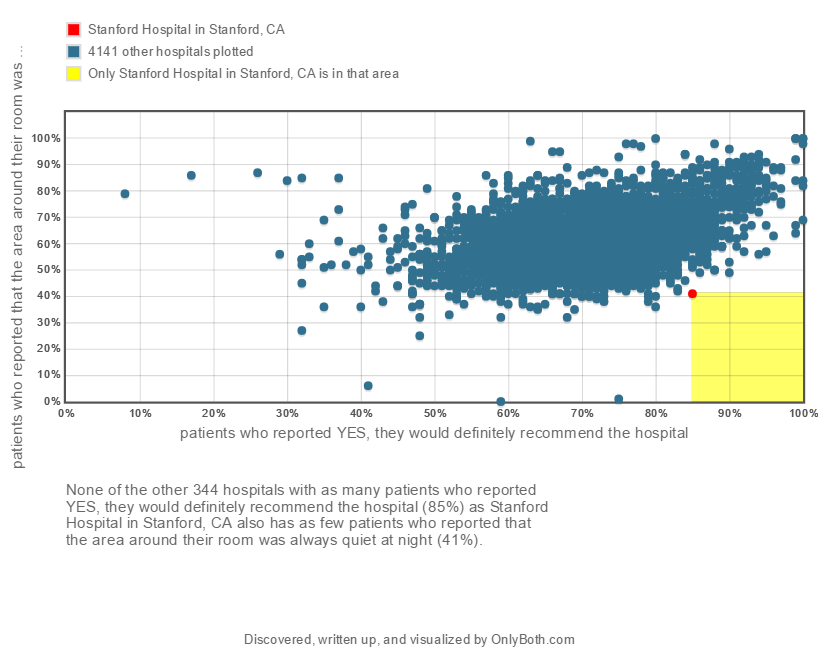
None of the other 344 hospitals with as many patients who reported YES, they would definitely recommend the hospital (85%) as Stanford Hospital in Stanford, CA also has as few patients who reported that the area around their room was always quiet at night (41%).
That is, among those 344 hospitals, it has the fewest patients who reported that the area around their room was always quiet at night.

This is clearly a provocative insight. One can imagine a hospital CEO reacting in one of these ways:
- We’re profitable, prestigious, and have great weather. What’s a little nocturnal noise?
- There’s been night-time construction next door for the last year, and it’s almost done, so the problem will solve itself.
- I can’t think of any reason why we should be at the bottom of this elite peer group. I’ll forward this paragraph to our chief of operations to investigate and report back what may be happening.
This peer-comparison insight wouldn’t be found by today’s conventional benchmarking methods. Instead, what may be found is along these lines: The average value for this quantity among 309 California hospitals with known values is 51.5% with a standard deviation of 9.5%, so Stanford Hospital is about 1 standard deviation below average. The reader can judge which of the two insights is the more action-provoking, not just for the single individual in charge, but for the entire team that needs to be roused to act on and address performance gaps.
So far, we’ve used some math to highlight the Tunnel Vision problem and shown specific examples, real or fictitious, of what is being missed. As our last step, let’s report the results of actual software experiments.
The website hospitals.onlyboth.com showcases the results of applying an automated benchmarking engine to data on 4,813 U.S. hospitals described by 94 attributes, mostly downloaded from the Hospital Compare website at Medicare.gov. A combinatorial exploration of peer comparisons among the 4,813 hospitals turns up 98,296 benchmarking insights that survive the software’s quality, noteworthiness, and anti-redundancy filters, or about 20 per hospital. In this hospitals experiment, insights were required to place a hospital in the top or bottom ten within a peer group of sufficient size.
There appear 522 different peer groups that are formed by combining the hospital dataset’s 24 non-numeric attributes in various ways. As noted above, the number of peer groups is much, much larger if one counts, not the attributes used, but the diverse ways to combine attribute values, e.g., the attribute “state” can either be used or not, so there are two alternatives there, but the number of state values is 50 (or more, including non-state territories), implying many more alternatives. The number of peer groups becomes still larger when accounting for dynamically-formed peer groups based on numeric thresholds.
Of course, the engine explored more peer groups than appear in the end results, which are those found to be large and noteworthy enough to bring to human attention. Also, each peer group appears in many insights by combining them with the available metrics. On average, each of the 522 peer groups enables over 900 individual hospital insights, by further combining each peer group and metric with different hospitals.
Summarizing, Tunnel Vision in peer comparisons, or benchmarking for understanding and improvement, is widespread but misses a vast number of noteworthy and action-provoking insights that could help improve organizational performance. Without automation, there aren’t enough people and time in the world to explore what’s outside the Tunnel, select the best insights, and bring them to human attention. Software automation is the way forward.
Raul Valdes-Perez
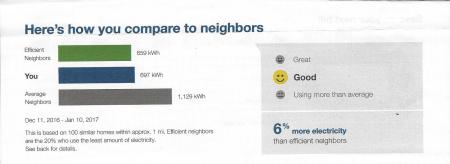 Surprisingly, this simple trick works. People change their behaviors when they see how they stack up against others. In multiple experiments run by the utility companies, providing benchmarks reduced overall power usage 2%.1 That may not sound like much, but across millions of homes the savings are substantial, helping power companies meet their government-mandated conservation goals. Similar outcomes from communicating descriptive norms have been shown in hospitality (reusing towels more often),2 voting (increasing turnout),3 and charitable giving (boosting the number of donors).4
 OnlyBoth has launched a County Benchmarking Engine as its newest showcase application and public service, leveraging the availability of federal as well as private-sector data on all 3,143 U.S. counties. We collected data on 104 county attributes by these topics:

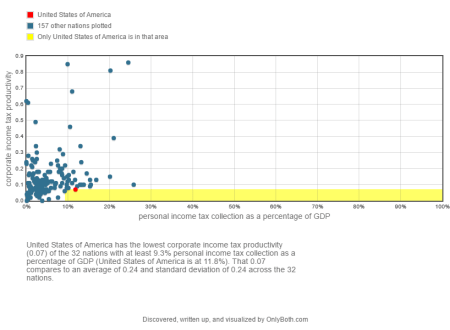 A separate insight reveals that the U.S. has the lowest corporate-income-tax productivity of the 17 nations with an agriculture sector as a percentage of GDP of at most 1.6% (the U.S. is at 1.2%).

